
A (Slightly) Mechanistic Theory for Exponentially Increasing AI Time Horizons?
AI ‘time horizons’ are mostly not about time (I think it’s mostly ‘data’, but you’ll see where I’m unsure)

One chart from 2025 has become perhaps the most (in)famous in modern AI commentary.
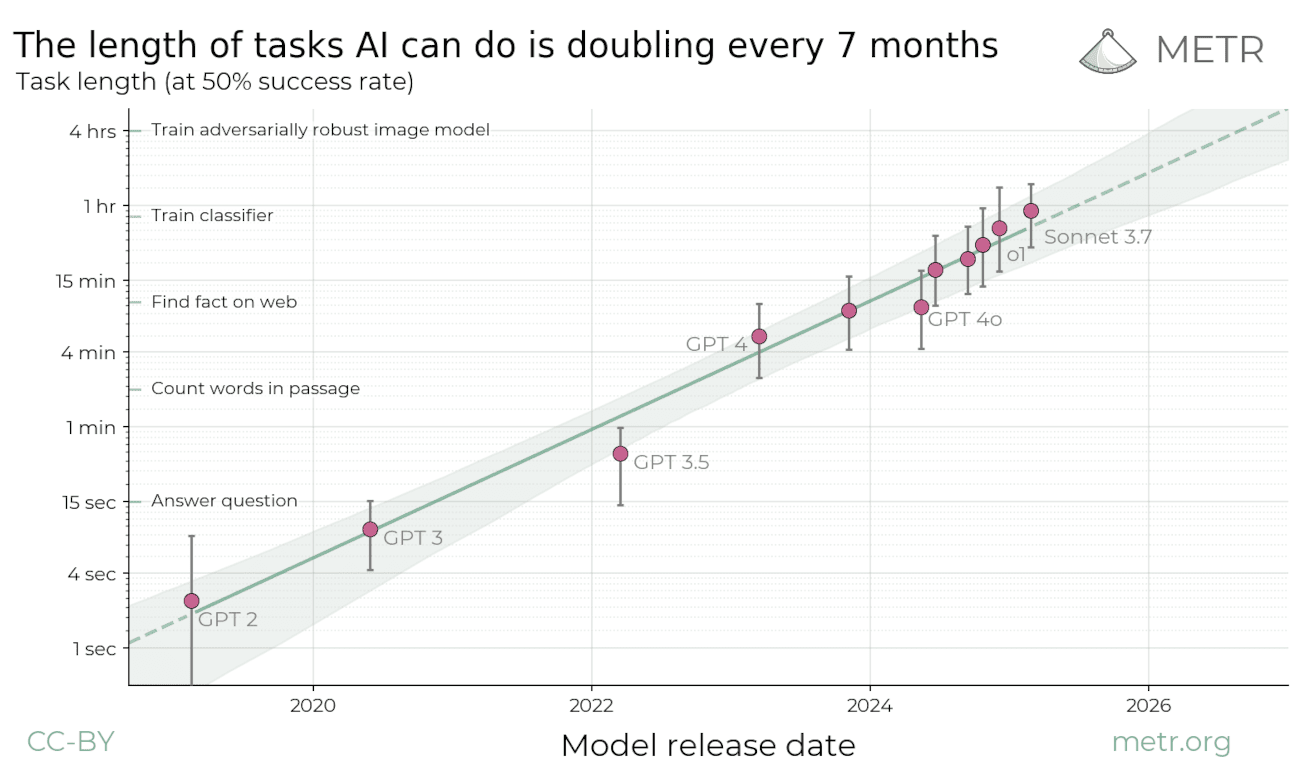
For those in the know, ‘the METR graph’1 is unusually compelling because it achieves what so few measures of AI progress have achieved: a somewhat meaningful Y axis (‘time horizon’2) as well as a somewhat predictable trend over time! (This is remarkably rare!)
Frustratingly, the only superficially available takeaway is something like, ‘the line goes up straight-ish over time’. This is better than nothing, but it’s very dissatisfactory from the point of view of getting confidence in the predictions, because it exposes no deeper mechanism. This drives a lot of confusion and argument about the implications.
A deeper mechanism would be good for two reasons:
It enables a sanity check on the trend, perhaps enabling more confidence in its predictions than we would sensibly allow with only the surface understanding.
It gives some way to interrogate when and how the trend might change (because if the deeper mechanism gets deflected, the superficial projection would be broken, but a prediction based on the deeper mechanism might stay viable for longer).
(A sub-reason: if we want the trend to change, knowing some more mechanism might shed light on some levers to pull rather than sitting around to wait and see.)
As an analogy, a similarly superficial trend, Moore’s Law, can be a little better mechanistically explained by the more general Wright’s Law3. This is great, because that law covers more cases, and it can handle some deflection from the trend, or give some idea of when (and under what conditions) the trend might break. Important when looking at plausible futures, and how to steer toward desirable ones!
Attempting to find some mechanism in the METR graph
Warning: mild maths incoming (consider reading on LessWrong for better rendering)
Task ‘length’ and success modelling
Why did METR focus on ‘task length’?
First, it’s not how long the AI agent takes. It’s how long the task in question takes a panel of sampled human experts, on average.4 So in their ‘time horizon’ measurements, METR is capturing the effective hours of human-expert-equivalent activity that AI agents can carry out.5
One way to think about the time it takes human experts to complete a task is that, for each subtask they had to know how to do (or be able to figure out how to do) and then successfully execute, the overall task takes incrementally longer. By how much? That depends on exactly what ‘subtasks’ we’re imagining breaking things down into.6 But on average longer tasks correspond to more distinct challenges, all else equal.7
This is the first piece of mechanism we should take into account. ‘Time’ is not agent time: it’s a noisy estimate for ‘number of somewhat challenging requirements necessary to complete the task’.8
This is treating overall tasks as formed by something like drawing ‘subtasks’ out of a large collection of possible requirements. Given the agent’s general competence, specific knowledge, tools available, and opportunity to retry or learn on the fly, sometimes the agent can meet these requirements. Other times it can’t.9 ‘Longer’ tasks simply draw more subtasks (that’s why they’re ‘longer’, in this model: expert humans had more subtasks they needed to carry out).10
Toby Ord demonstrates one way to take this intuition further, noting that if we explicitly model overall success S according to a simple model where chance of failure compounds with task ‘length’, t, we get a reasonable fit for the data METR collected. (Interestingly Toby mainly seems to continue treating this as ‘agent time’. I’ll instead take as given that we’re talking about a proxy for number of subtasks.)
In other words, for a given AI agent and task domain, there’s something like a ‘hazard rate’, P (per-subtask probability of failure), which reasonably well summarises (and predicts) the AI’s level of success in that domain:
(i.e. to succeed at a t-step task, the agent must not fail — must avoid the ‘hazard’ P — t times.)
This enables us to translate back and forth between an estimate of this hazard rate P and an estimate of a ‘half-life’ or 50% success horizon — how ‘long’ (i.e. complex) a task needs to be before the agent fails more often than not — and also to extrapolate to ‘durations’ corresponding to other reliability levels, like 99% or 99.9%.11
In this formulation, the hazard rate, P, stands in for what fraction of our ‘subtask’ pool the agent can’t (yet) succeed at, which ends up being a reasonable summary of the agent’s competence in this domain.12
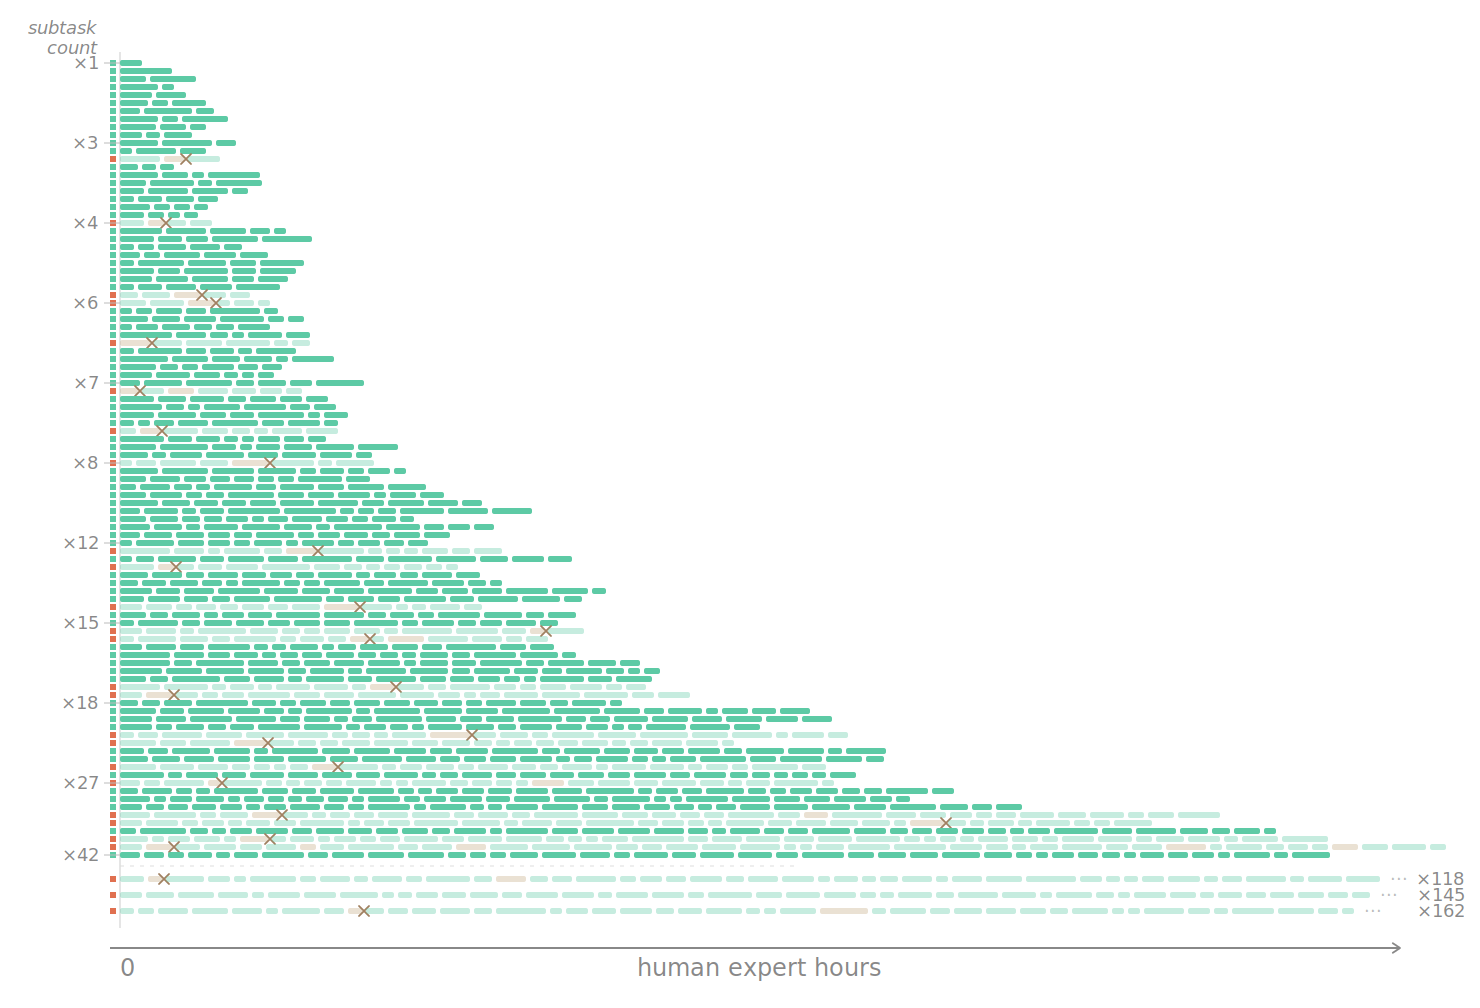
If you have a new task, you don’t know if the agent has all it needs to complete it. But the task ‘length’ is an indicator of how many tricky subtasks it has, and similar-lengthed tasks will have similar numbers of such subtasks — so their average success rate is a good estimate for how likely the agent is to succeed at this new task.
Relating hazard rate with frontier AI development
METR’s graph is compelling because it suggests a steadily increasing frontier of success horizon as AI developers produce new agents over time.
What does this imply if we interrogate our hazard rate model? Well, ‘half-life’ (and indeed various success-level horizons) is observed apparently growing exponentially with date D:
This is the central striking takeaway from the METR graph (modulo their measurement uncertainty). Half-life go up!
But half-life according to our model has:
where P is the per-step hazard rate from before. When this P is not too close to 1, that half-life is, fairly intuitively, approximately proportional to the reciprocal of the hazard rate:
So METR’s observation of rising time horizons is equivalent to saying that the frontier hazard rate is shrinking exponentially over time.
Recall that this hazard rate corresponds with the fraction of ‘subtasks’ in a domain that an agent doesn’t yet know how to complete. So this fraction is presumed to shrink roughly exponentially with date, in turn driving the observed ‘longer’ success horizons.
Why does hazard rate shrink with date?
Here’s where to look for the next bit of mechanism. Why would the hazard rate, the fraction of ‘subtasks’ which remain out of reach, shrink in that way?
It goes without saying that AI developers are chasing after increasing competence in their products, so (if they are doing anything at all right!) the direction of movement is unsurprising. Why that particular roughly-exponential form, though?
I confess here I’m uncertain and the quest for more mechanism continues.
My best guess is that it’s about the effective evidence available to the agent toward subtask solution strategy. Intuitively, if you’ve seen very similar subtasks many times before, it’s hard to go too wrong. If you’ve only seen vaguely similar subtasks once or twice, you’re in much less familiar territory and stand a good chance of stalling. Suggestively, effective evidence and training data are both information-like quantities, but I don’t want to make too much of that without a crisper connection. Formally, we could consider how many bits of evidence the agent can muster about how to proceed (either from past learning or by exploring in context).
In other words, training produces learnings. These range from broad, generally-applicable heuristics for adaptable, effective behaviour (experiment, test your work, notice when something surprising happens, read the manual if you can find one, accrue power and resources at any opportunity, ...), to narrow specific details about particular situations and activities (Earth’s radius is roughly 6.4 megameters, detonating TNT yields roughly 4.2 kJ/g, humans succumb to oxygen deprivation after around 5 minutes, …). Ahem.
Empirically, AI developers have historically poured something like exponentially increasing ‘quantities’ of ‘data’ into their machine learning pipelines.13 Mathematically, that implies a power law: data inputs n_train rising at one exponential rate, matched by hazard rate P decaying at another exponential rate.
Power laws aren’t deeply mechanically explanatory, but they’re often the best we have in machine learning, and are at least more predictable than mere date-based trends. Under the simple subtask model described here, this power law translates directly into a power law between ‘time horizon’ and data. This is actually the same level of explanatory improvement offered by Wright’s Law over Moore’s: not fully mechanistic, but an extra layer of detail which offers firmer purchase on what’s going on.
What this doesn’t straightforwardly account for is the benefit to success rates of increased in-context reasoning, which is exhibited according to METR’s estimates. I expect this is operating on those borderline subtasks — where the agent would have some slim chance of satisfying them if it ‘rushed’. In those cases, ‘thinking harder’ may more effectively recall and combine the relevant learned knowledge, and allow better choices for exploratory discovery in situ. In any case, changing the thinking budget of an otherwise similar existing system certainly calls for a more mechanistic understanding than mere date-based trend extrapolation!
I would be thrilled if someone with more smarts, time to experiment, and access to data were to dig into ways we could match up various AI production inputs (especially ‘data’ in various forms) with observed outputs like ‘time horizon’. One of the more difficult pieces might be quantifying ‘data’, especially teasing apart what types of evidence are ‘relevant’ for the domain and tasks at hand.
Upshot
The kind-of-boring upshot of this is that data and ‘practice’ on related tasks makes AI better at those tasks! This is boring because, well obviously!, we already basically knew that. But it’s encouraging because we can say a little more than that, which gives us some better grasp on what’s driving ‘time horizon’ progress in particular domains — and it can help get more precise about predictions.
The fact that the ‘subtask’ model — with a ‘hazard rate’ of subtasks currently out of reach — is a fairly explanatory fit for capability profiles of individual agents is evidence that there’re not unusual amounts of generalisation capability in AI. As with humans, they can extrapolate a bit, but need ‘experience’ and examples to succeed.14 Importantly, this means that vast in silico training ranges for software, cyber, and mathematics very likely won’t transfer much to other domains of interest, like interpersonal intelligence, medical discovery, bioweapons development, intelligence analysis, and robotic manipulation. Of course, like with every domain of human experience and activity, we have some relevantly-similar data already collected, and schemes can be devised to more rapidly expand that digitised experience bank for AI to learn from. Increasing adoption of AI in task-integrated contexts, industrial deployment, and even explicit approaches to gathering example data such as ‘hand movement farming’ are the leading indicators to watch for progress in particular domains — not just the headline benchmark metrics in software-like tasks.
For some types of activity, developers are probably ‘running out’ of raw example data to scrape from the internet. The era of mostly-pretraining is over. For domains which can be relatively easily verified, like mathematics and coding, this is very surmountable — you can just run drills galore on a computer and get data that way. But this costs extra compute and doesn’t scale at the same exponential rate for long (perhaps 10x/year presently). As soon as this year, developers could be back to ‘only’ scaling compute around 4x per year (and a bit after that they might have bought most of the compute! — and will only be able to scale at the positively sloth-like 1.5x-ish a year of underlying hardware progress). I don’t feel confident extrapolating exactly where that cashes out, but if the data-driven subtask-learning model is right, it would imply we should see less steepness to the time horizon growth quite soon.15
Some commentaries project that, once AI can autonomously do software and machine learning work reliably, it will thereafter enter a ‘recursive self-improvement’ phase and rapidly colonise all capabilities. I don’t think this is missing the point entirely: there will be modest multipliers on the speed of the AI development pipeline, and we might see an ‘explosion’ in the speed and cost-effectiveness of AI (because they are among the most immediately-verifiable properties to iterate on). But generalisation doesn’t come for free, so on-task data and compute will remain crucial to broadening the frontier of autonomous capabilities. Collecting that data and manufacturing that compute look to me like the rate-limiting steps, and therefore the major leading indicators to use in foresight. The best case I can make for a much more general explosion is if the speed and cost-effectiveness explosions rapidly accelerate the gathering and digestion of diverse task data — but I think that remains mostly rate-limited in the familiar ways: some domains easy and some more difficult. Don’t mistake me for ruling out across-the-board AI capability! Companies are charging ahead with data collection and set on automating much of their AI production pipeline. It just won’t happen overnight.
Thanks to Coz Ududec for a conversation prompting me to think about this.
Very importantly, it’s measured within a particular collection of challenges/tasks which are mostly associated with software development, especially ML engineering. METR also has a great preliminary study of some other domains, finding differing, but perhaps also somewhat predictable trends.
Moore’s Law is the very superficial observation that, over time, the number of transistors per chip doubles roughly every two years. (More recently, it’s been more clearly expressed as the price per transistor halving every year-or-two.)
Wright’s Law is the slightly more mechanistic and general observation that production of many commodities follows ‘learning curves’, such that each doubling of cumulative production produces roughly similar relative cost savings. (We can in turn attempt to explain this in yet more mechanistic terms, pointing to the insight gained from observing and recording many trials and experiments, with suitably diminishing returns.)
Now, if the quantity demanded and produced grows exponentially over time (as it has for computer chips), then Wright’s Law predicts comparable cost savings each year: Moore’s Law. If the quantity produced grows (or shrinks) in some other pattern over time, Wright’s Law, by accounting for this mechanistic detail, canoften forecast cost trends more reliably than Moore’s.
Also note that the estimation of ‘task length’ according to human experts was quite crude (naturally, humans are the most expensive part of most experiments!), and there are good reasons to treat the reported error bars as much too narrow, i.e. misleadingly confident. I’ll use quotes around ‘time’ related quantities in this post as a reminder that it’s a loose estimate of a crudely human-performer-derived time-to-completion for tasks, and doesn’t correspond well to real time as such.
I don’t know if METR publishes how long the agents themselves take at these tasks — I don’t think so, and it’d arguably be ill-defined anyway since it would depend in part on how fast a computer you ran the agent on.
If we conceptually carve up subtasks into smaller pieces, they'll be quicker per piece, but there are commensurably more of them, and vice versa.
This could come apart if longer tasks are systematically more likely to include repetitive similar activities rather than a series of distinct ones, for example. Or longer tasks might tend to admit more truly alternative pathways. Both these effects could make longer tasks slightly easier than the naive picture. There are also higher-level ‘orchestration’ tasks i.e. coherently coming up with (and executing and adapting) an appropriate sequential plan: perhaps these might be systematically more difficult for longer tasks.
Notably, agents sometimes take a (relatively) longer time to do something that’s quicker for humans, and vice versa.
Incidentally, success (or not) here already accounts for the agent attempting and re-attempting steps or fixing earlier mistakes, which might take variable amounts of time: another reason not to treat this as agent time. Some subtasks might be intermediate and succeed sometimes (for example if the agent can’t easily choose the best approach but sometimes hits on the right one, or sometimes gets stuck in a terminal cycle but sometimes makes lucky progress.)
This is throwing away some detail: obviously not all subtasks are equally likely to follow from each other! There’s some correspondence between on-task sequences. But within a particular domain (like software engineering), this naive model of overall tasks combining subtasks somewhat randomly seems to do OK.
By the way, the rule of 72 provides a really quick mental approximation for the higher-reliability ‘time’ horizons, depending on the ‘half-life’ (the 50% ‘time’ horizon).
Divide the ‘half-life’ by 72. That’s the 1% failure horizon (equivalent to the 99% success horizon). Multiply by your target failure rate in percent, and you’re done: that’s your target success ‘time’ horizon. E.g. if ‘half-life’ is 1h, the ‘time’ horizon at 99.9% is (1h/72)*(0.1) i.e. 5 seconds.
(This also reveals that cutting the ‘time’ horizon tenfold cuts the average failure rate tenfold and so on.)
Going the other way, estimating long-horizon success rates, divide your target horizon by the ‘half-life’. That’s how many halvings of success to expect: raise one half to that power for your success rate. E.g. if ‘half-life’ is 1h, your 24h success rate is (½)^24 i.e. one in sixteen million.
It didn’t have to be that way! A single number which manages to explain a lot of variation in agent capability is very suggestive of an underlying mechanism something like the ‘fraction of subtasks’ model I’ve described here. Of course there is still some residual uncertainty and there may be better summaries available with a more detailed model or epicycles on this one.
This may recently be trickier to measure as training pipelines have adapted to incorporate more reinforcement learning, which means these experience data are less ‘homogeneously slurped up from the internet’ and increasingly ‘proactively curated from in-domain training curricula’. So the mere quantity of data isn’t like-for-like over time.
In fact contemporary AI is perhaps substantially less good at generalisation than humans, though I’d like to be better informed about how factors like sample efficiency of AI learning (including in-context learning) stack up.
Actually saying something so bearish about AI makes me nervous, as there is a venerable history of people boldly declaring AI is about to hit a wall! But I think it’s borne out. I’m not saying progress stops, I’m saying it probably gets slower (in exponential terms).
Good article, I like the subtask / hazard rate formalization and the concrete prediction about the expected slowdown.
But how do you then picture the arrival of general AI?
I find it hard to reconcile “generalization is poor, generalization from math-y domains to non-math-y domains is bad, and we still need more data” with “coin flip chance we will have human-level AI systems in under five years.”